At Loop, our mission is to reduce the carbon emissions from homes. Our net-zero journey shows that emissions from heating are on average four times the emissions from electricity. Tackling heating is central to a low carbon home!
As well as a climate crisis, we have a cost of living crisis. An average household at the current price cap will spend around £1000 on gas this year. This is the average. Lots of homes will spend much more and prices are likely to rise further.
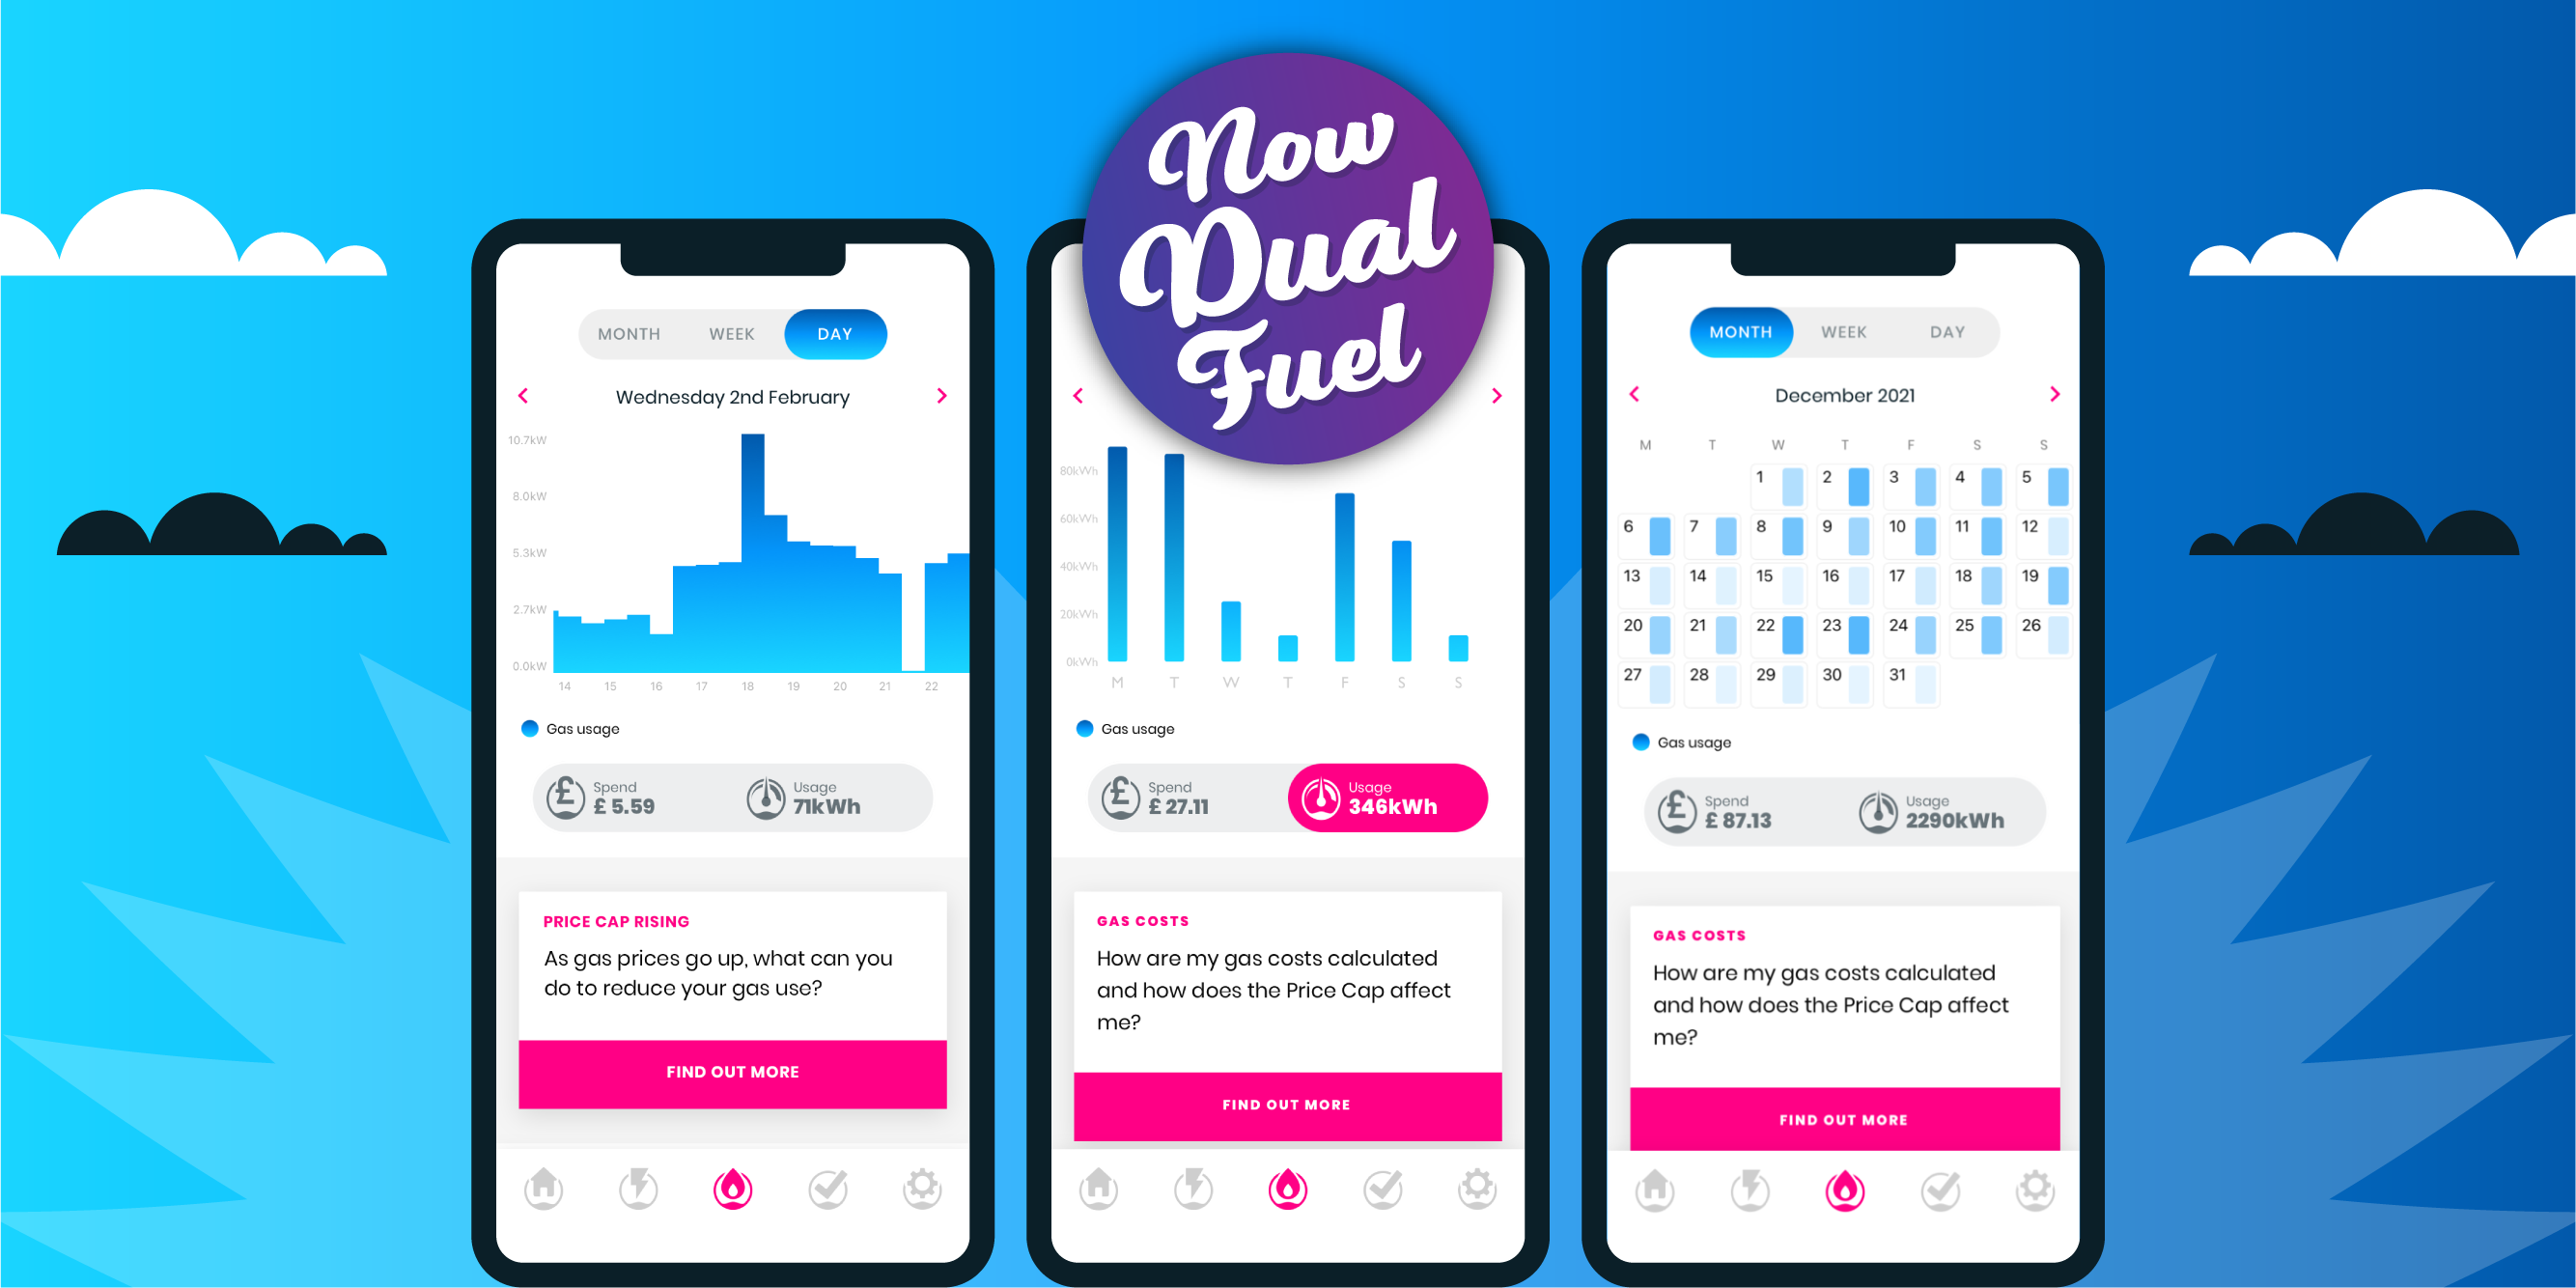
We made the Loop app compatible with gas smart meters to help Loop customers use less gas, to lower their bills and reduce their carbon emissions. But is it possible to reduce your gas usage and still stay comfortably warm?
To answer this question, we’ve analysed the initial smart meter gas data we’ve received. We also surveyed a part of our customer base in partnership with Nesta. Some of the questions we asked were:
- How satisfied are you with the temperature of your home over the past two weeks?
- How comfortable have you been in your home over the past two weeks?
- Have you already turned your heating off for spring/summer?
Building an instinct for gas use: it’s all about the weather
At Loop, we want to help our users understand how and when they use energy. With gas, it’s all about the weather.
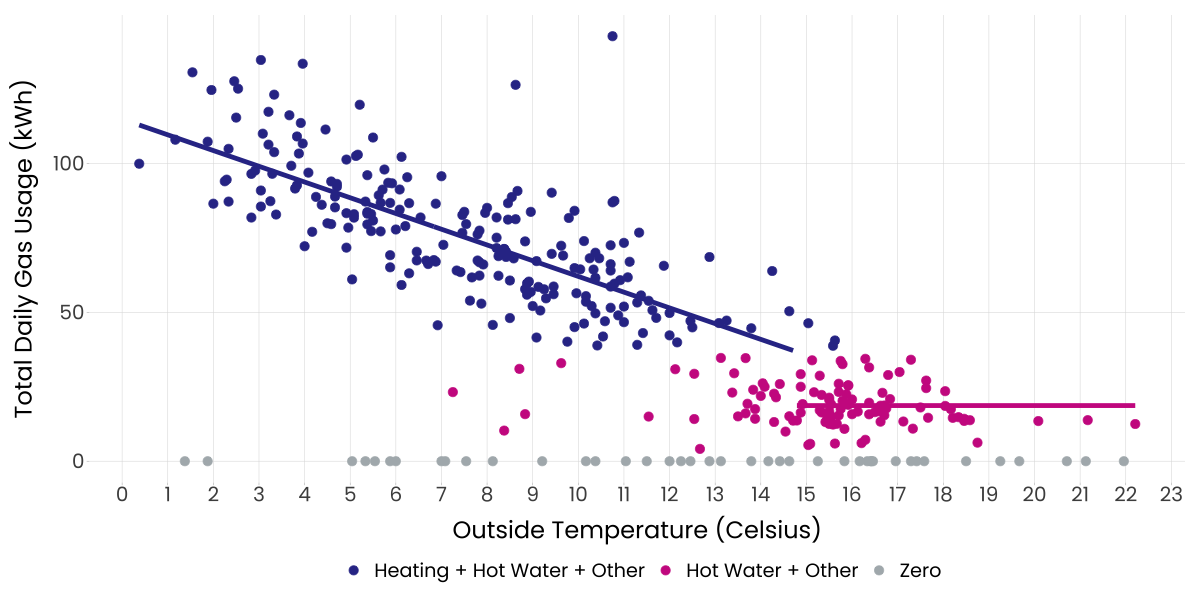
To see this, let’s take a look at a year’s worth of gas data from an example household 1. In the graph below, daily gas usage (in kWh) is plotted against the average temperature outside that day. When the heating is on, the amount of gas needed increases in a straight-line relationship with the decreasing outside temperature (blue dots). Apart from a couple of unusual days, the most gas is consumed on the coldest days. Above a certain temperature (around 15°C), gas is only being used for hot water and cooking (pink dots).
From this graph, we can estimate that 67% of the gas consumed went on heating.
Is this typical? We performed a similar analysis for 435 of the users who completed the Loop/Nesta survey 2. On average, 74% of the gas they used was for heating their home.
As it accounts for such a large percentage, it is clear that tackling heating is key to reducing gas usage. Our article on home insulation and draught-proofing provides cost estimates for several energy efficiency measures, but is it possible to make any ‘no cost’ changes while still staying warm in winter?
No-cost change: Turning the heating off for spring and summer
We sent out the survey at the end of April and received around 1300 responses. A standout result was that exactly half of respondents had turned their heating off and the other half hadn’t. It was an unexpected result and we wanted to understand this better. Does the heating still come on in the spring and summer and, if so, is it enough to significantly increase a heating bill? Would turning the heating off in the warmer months leave the house uncomfortably cold?
On the survey, both those that had turned off their heating and those that hadn’t reported high levels of comfort. There was very little to choose between them. This makes sense as days are getting longer and the sun does a good job of heating the home. So how much would a household save by turning their heating off?
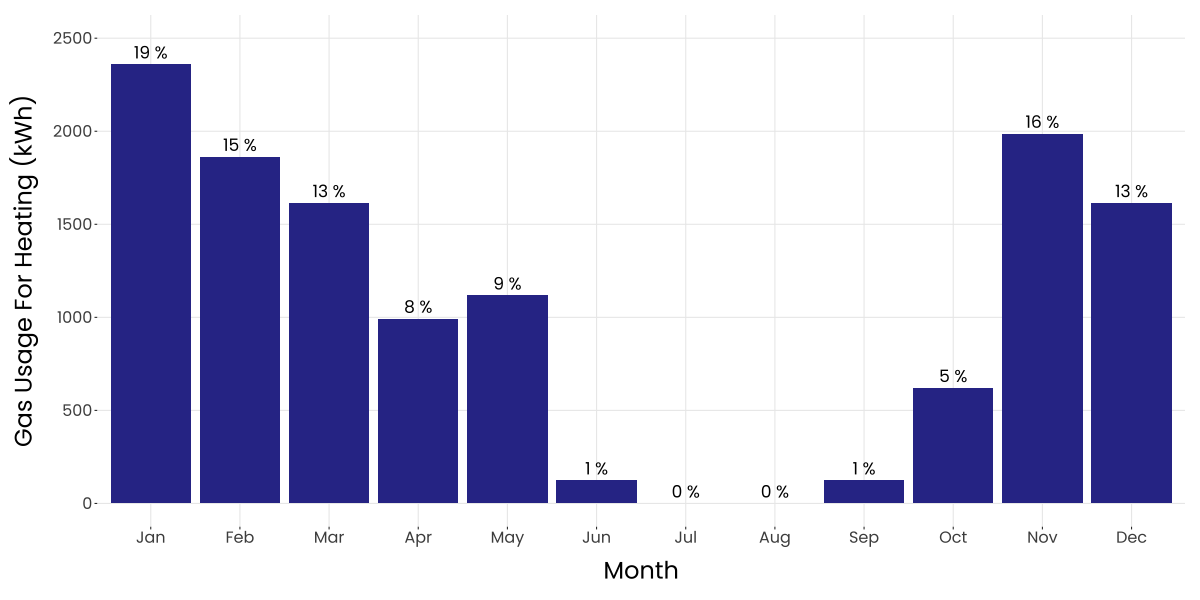
Let’s look again at our example household. We know they keep their heating on for the spring and summer (we asked them). The second graph shows the amount of gas used for heating each month 3. The number above each bar is the percentage of the annual usage used in that month. For example, 19% of their annual gas used for heating was used in January.
Usage is significantly higher in the winter than the summer as you would expect. From June to September, almost no gas was used for heating. What’s interesting is if we take a look at April and May, where we can see that, taken together, these months account for 17% of this household’s total spend on heating. At the energy price cap introduced on 1st April 2022, turning the heating off at the beginning of April and switching it on again at the beginning of October would save £175.
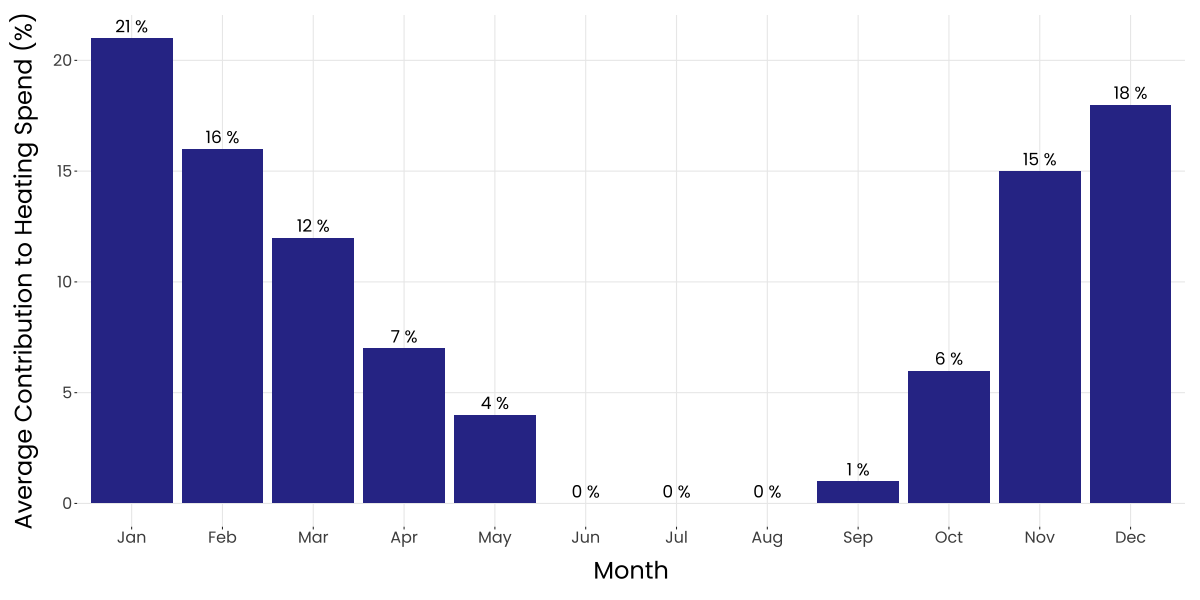
Is this typical? We repeated this analysis on 234 of the survey respondents who still had their heating on at the end of April 4. The results are shown in the graph below. 12% of the total gas used for heating was used from April to September.
No-cost change: Turning down the thermostat by 1°C
We’re often told to reduce our thermostats to save money. This will affect the level of comfort but how much will we save? Given a home’s gas data, Loop is able to estimate the annual saving if the thermostat temperature is reduced. (We don’t need to know what temperature the thermostat is set at to do this.)
Across 435 users, the average reduction in gas used for heating if the thermostat was reduced by 1°C was 12%. For our example household, this number was 9% and they could expect to save around £84 a year. But it varies from customer to customer. Giving personalised estimates allows for an informed decision.
Final thoughts
At Loop, we’ve found that personalised insights are super impactful. They enable users to make informed choices about behaviour changes. For many homes these changes lead to significant savings.
We’re constantly improving the Loop app. With gas, there’s a long way to go! Understanding and optimising your heating is a great first step. But there’s then understanding your insulation and improving it if needed, optimising the setup of the boiler itself and then finally moving to electric heat. We’re looking to give each of these the same Loop treatment.
About the author
Ruth is one of Loop’s data scientists, developing models and algorithms to help customers understand their energy usage. Before starting work with Loop, she completed a PhD, where she used fMRI imaging data to model human brain connectivity.
1 Explicit consent was obtained from this user to share their data in this blog.
2 Not all the users who completed the survey had data suitable for this type of analysis.
3 Data is from 1st May 2021 - 30th April 2022. It is arranged by month for easier visualisation.
4 Data from 16th May 2021 to 15th May 2022.
• • •
With Loop, you can find out how you use electricity, then make smart decisions about using less.
Got a smart meter? Great news! Link the Loop app and enjoy full access to all Loop benefits for free, no purchase required.


